


Naples Real Estate · Market Report
Naples Housing Market Report: Prices Hold Steady as Inventory Tightens Into Season
Sales climbed for the fifteenth straight month, months of supply compressed from 8.1 to 5.4, and the median price landed exactly where it was four years ago. Here is what the latest NABOR numbers actually mean if you're buying or selling in Naples this fall.

Every month, the Naples Area Board of REALTORS® (NABOR) publishes the definitive read on our local market, drawn from Southwest Florida MLS data for Collier County (excluding Marco Island). The August 2026 report — the most recent official release — tells a story that's easy to miss in the headlines: this is no longer a market correcting downward. It's a market quietly tightening, just as the winter-season buyers who drive Naples real estate begin to arrive.
Closed sales rose 1.1% year over year to 622 — the 15th consecutive month of annual increases — and pending sales are up 21.7% year-to-date. But the real movement is on the supply side. New listings fell 15.5%, active inventory dropped 16.3% to 4,093 homes, and months of supply compressed from 8.1 months a year ago to 5.4 months — squarely in balanced-market territory by the traditional six-month benchmark.
The headline numbers
Prices are holding, not falling. The $575,000 overall median is down just 1.7% from a year ago and only 0.8% since January — and here's the detail that puts it in perspective: the August 2022 median was also exactly $575,000. Four years, one flat line. Underneath that calm surface, single-family prices are up 4.1% year-to-date while condos have softened 4.3%, and the average closed price actually rose 8.6% to $1,017,608 as high-end sales made up a bigger share of the mix.
Sellers are also holding firmer. Price decreases plunged 30.2% (from 1,132 to 790), and buyers paid 94.8% of asking on average — a full point more than last August. Homes moved faster, too: 99 average days on market, down from 107.
Thirteen months of prices: stability, not decline
The monthly trend tells the same story. The median peaked at $650,000 in February 2026, eased through the spring, and has settled into a $585,000–$610,000 range.
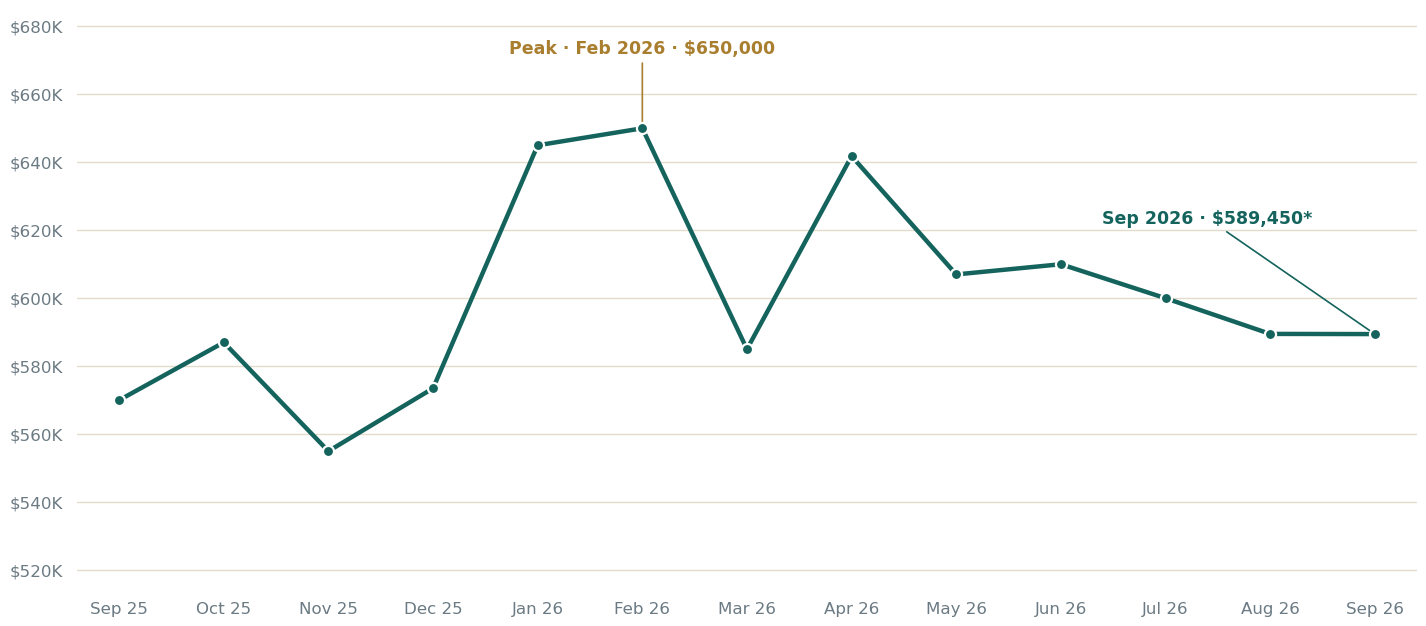
Monthly overall median closed price, Sep 2025 – Sep 2026. Source: InfoSparks / FGCMLS via Stellar MLS (secondary series; coverage differs slightly from NABOR's Collier County scope). *September 2026 is preliminary. Official NABOR medians: Jul 2026 $590,000 (+2.6%); Aug 2026 $575,000 (−1.7%).
A barbell market: strength at both ends
The most interesting pattern in the August data is where the growth is concentrated. Over the trailing twelve months, closed sales under $300K rose 35.7% and sales in the $1.5M–$5M range rose 34.2% — while the $500K–$1.5M middle grew just 9.8%. Entry-level and luxury are thriving; the middle is merely steady.
The biggest shift of all: the $1.5M–$5M tier's months of supply collapsed from 10.3 to 5.3 months in a single year — a 48.5% drop, the largest of any price range. That tier has flipped from a buyer's market to a balanced one, and it is now tighter than homes under $300K (6.1 months). Above $5M is the exception: 9.7 months of supply (13.4 for condos) still favors buyers — though sellers there received 92.7% of asking, the only tier where that figure improved, on homes averaging 156 days to go under contract.
By layout, three-bedroom homes are the tightest segment in Naples at 4.5 months of supply (4.2 for single-family). One-bedroom homes are the one loosening segment — 10.6 months of supply, sales down 16.5%, median down 14.3% to $180,000. If you're hunting for negotiating room, that's where it lives.
Neighborhood snapshot
August played out very differently across the county. Four stories worth knowing:
North Naples
Single-family median (ZIPs 34109, 34110, 34119) — the county's tightest single-family market at just 3.9 months of supply, down from 6.0. Year-to-date SF median: $1,055,000, up 8.2%.
South Naples
The comeback story (34112, 34113): single-family sales surged, days on market fell 27.9% to 80, and supply tightened from 7.9 to 4.7 months. The only area where SF new listings rose (+26.1%).
Naples Beach
Supply down from 12.3 as SF inventory fell 28.8% to 351 homes (34102, 34103, 34108). August SF median hit $2,710,250 on 40 sales — though year-to-date it's $2.9M, down 6.5%; one month isn't a trend. Condo median rose 13.7% to $852,500.
Immokalee / Ave Maria
The soft spot: the only area where SF supply rose. Days on market climbed 82.8% to 117 and year-to-date SF sales are down 21.6% — currently the county's most buyer-friendly pocket.
Luxury keeps redefining itself
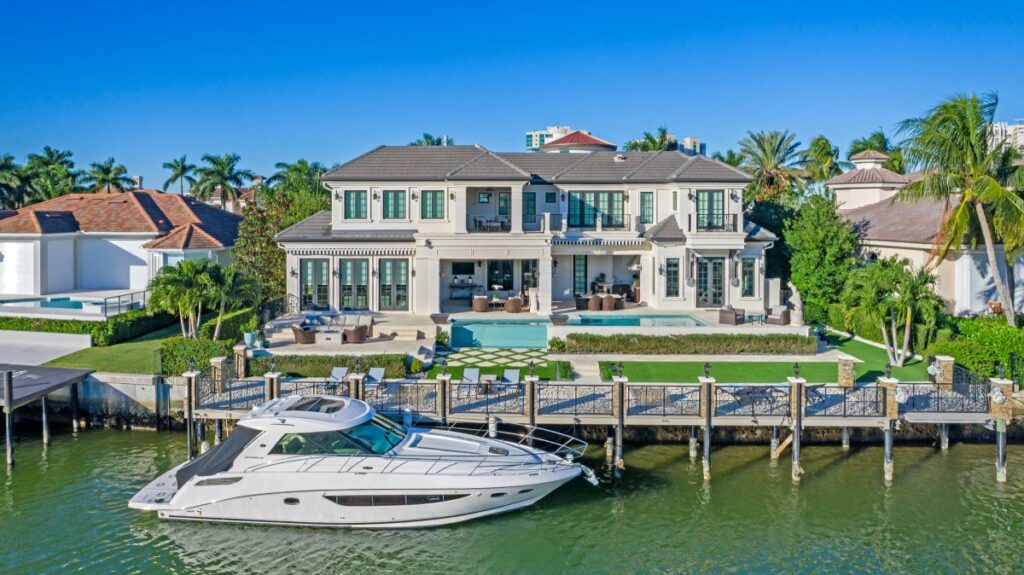
Naples luxury is a market unto itself. Realtor.com data reported by the Naples Daily News in September puts the entry point for luxury at roughly $3.7 million — among the four most expensive luxury markets in the United States — with the ultra-luxury threshold at $16.6 million. Entry-level luxury pricing is up 88% since before the pandemic, and about 35% of all Naples listings are priced at $1M or more, versus 14% nationally.
The summer's activity backs it up: ten sales above $10M closed in July alone, three of them above $20M. Cash dominates the upper tiers, which is a large part of why Naples' top end keeps performing even with mortgage rates at their highest since 2023. New construction is pushing the ceiling higher still — Olana Naples Residences, twelve beachfront estates from $32M, broke ground this fall after securing a $197M construction loan, and the Four Seasons Residences at Naples Beach Club opens its first 58 beach-side homes this year.
Rates and the wider picture
Financing remains the headwind. Freddie Mac's survey for the week ending October 15, 2026 puts the 30-year fixed rate at 7.40% — unchanged week over week, up from 7.28% on October 1, the highest since November 2023, and well above the 6.27% of a year ago. Florida Realtors' chief economist attributes the statewide sales slowdown largely to these climbing rates: statewide, September single-family sales fell 3.5% even as the median rose 1.2% to $415,000.
Naples outperformed the state. The Naples metro (Collier County) posted 365 single-family sales in September, up 2.0% year over year, at a median of $785,000 (+1.6%) — nearly double the statewide median. Collier County's population reached 417,131 in the latest Census estimates, up 11.0% since 2020, and that long-run demand story hasn't changed.
September sneak peek — preliminary
NABOR hasn't published its official September report yet (expected around October 23). MLS-based sources put September's overall median at $589,450 (+3.4% year over year), with single-family at $782,500, condos at $395,000, 602 closed sales, and supply steady at 5.4 months. One caution: preliminary sources disagree with each other — a separate MLS feed shows a $747,500 single-family median — so treat these figures as provisional until NABOR confirms them. We'll update this post with the official numbers when they land.
The bottom line
If you're selling: the window is favorable and improving. Inventory is shrinking, price cuts are down 30%, buyers are paying closer to asking, and the seasonal buyer pool is about to arrive. Correctly priced homes — especially three-bedrooms and anything in the $1.5M–$5M band — are meeting a tighter market than a year ago.
If you're buying: your leverage depends entirely on the segment. Above $5M and in one-bedroom homes, buyers still hold the cards. In the tightest segments, expect competition and plan accordingly. And with rates at 7.40%, the cash-heavy structure of this market means well-qualified buyers who can move decisively have an edge that the rate sheet alone doesn't show.
Thinking about a move in Naples?
Browse the newest Southwest Florida listings, or reach out for a pricing read on your home based on the latest NABOR data — not last year's headlines.
Browse Naples listings Visit osflorida.comSources & notes: Primary data — Naples Area Board of REALTORS® (NABOR) August 2026 market report, released September 25, 2026 (Collier County excluding Marco Island, Southwest Florida MLS): naplesarea.com. Segment and area analysis of NABOR data: Your Naples Expert. Price trend and preliminary September figures: InfoSparks/FGCMLS via Stellar MLS, Worthington Realty. Luxury thresholds: Realtor.com via Naples Daily News (Sept 23, 2026). Rates: Freddie Mac PMMS, week ending Oct 15, 2026. Statewide and metro figures: Florida Realtors (Sept 2026) and FGCU Regional Economic Research Institute. Population: U.S. Census Bureau QuickFacts (Vintage 2025). Average closed price and percent-of-list figures are from secondary analysis of the NABOR report. This post is general market information, not an appraisal or financial advice; statistics are believed reliable but not guaranteed.